
Timing the grain markets through the understanding of cycles.
Identifying the major trends that bring you the most profitable opportunities.
making the complex understandable
Grain Market Timing
There is a significant risk of loss in trading Futures & Options. Past performance is not indicative of future results. Any decision to purchase or sell as a result of the opinions in this report will be the full responsibility of the person authorizing such transaction.
Copyright © 2011 Grain Market Timing, All rights reserved.
"Wheels within Wheels"
It is most likely that W.D. Gann used this phrase "wheels within wheels" to describe planetary cycles. The picture of the planets orbiting the sun is a very simple picture that is represented well by the phrase "wheels within wheels". It is a picture of the smaller Mercury cycle rotating inside the larger Venus cycle which in turn rotates inside the next larger planet Earth and so on. He very likely borrowed the phrase from the Bible, a book he studied fervently. In Ezekiel 1:16 a vision is described in part by the words "...their appearance and their work was as it were a wheel in the middle of a wheel."
If this is the first time the you have been introduced to studying the markets in this manner it is likely you are somewhat taken aback. Imagine W.D. Gann trying to explain these type of concepts to the public in the 1920's. It was not easy!
If this is the first time the you have been introduced to studying the markets in this manner it is likely you are somewhat taken aback. Imagine W.D. Gann trying to explain these type of concepts to the public in the 1920's. It was not easy!

Thus far, we have studied the motion of TIME moving around the circle. To this point we have only measured the movement of the Earth in its orbit. However there are obviously many other planets in our solar system. When studying TIME Gann used these other planets as well. A famous personal chart of his shows where he plotted the position of both Mars and Jupiter on the chart. In other words he marked the price on the chart where those two planets' position would correspond in price. This is what our analysis began with in the lesson of "Time equals Price". As you can now see, that phrase teaches us that the position of a planet moving around the circle has a value that is equal to a Price. Among other things I believe Gann noticed a very simple concept that provided him with predictability in market behavior. When analyzing turns in the markets, one begins to notice that these turns are synchronized with successive planets arriving at the same location on the circle. To illustrate this assertion we will use an example in the Wheat market. Using another market beside corn or soybeans has the added benefit of proving that these principles are universal.
In the following explanation, I would like to draw your attention to a series of turning points in the nearby Chicago Wheat chart. The "wheels within wheels" principle will be illustrated by showing that the market turns as each successive planetary cycle reaches the same position on the circle.
In the following explanation, I would like to draw your attention to a series of turning points in the nearby Chicago Wheat chart. The "wheels within wheels" principle will be illustrated by showing that the market turns as each successive planetary cycle reaches the same position on the circle.
Mars and Earth (all planetary positions are heliocentric)
On March 15, 2011 Wheat makes an important low. At this low mars is at the position of 9 Pisces. At this low the earth is far behind mars and would not reach this position until the end of August. When the earth reaches this previous position of mars, Wheat makes a significant top on August 29, 2011. At this top mars has advanced to 17 gemini. The earth would reach the position of 17 gemini on December 9. Notice where Wheat bottoms next. On 12-9-11 Wheat makes a major low as the earth reaches 17 gemini. As we continue this principle, notice the position of mars at the 12-9-11 low. It is 6 leo. The earth reaches this location at the end of January. Wheat would trend higher until February 1, 2012.
Notice how these turns are separated by less and less time as we progress. This is because the earth moves faster than mars and is closing the distance between the two planets on the circle of 360 degrees. The earth finally catches up to mars in March 2011 where they conjoin. After this conjunction the earth is pulling away from mars and would reach the point on the circle first. For example look at the major low of May 11, 2012. Here the earth is 20 degrees scorpio. Mars would not reach this position for another 2 1/2 months. Wheat experiences a dramatic rally that tops out on July 20, 2012 when mars reaches the position of 18 scorpio. This principle is more than remarkable. The market is trending until the next planet reaches a predetermined position on the circle.
At this point I would also like to include evidence of our earliest concept, namely that "time equals price". Notice that on May 11, 2011 nearby Chicago Wheat bottoms at $5.90. On the circle, 590 is equal to 20 degrees scorpio, which is the position of the earth on May 11. This means that the low of $5.90 is meeting the earth's position or squaring out with the earth. As was discussed above, when the top is reached on July 20, 2012 mars is just a couple of degrees short of this same position when it reaches 18 scorpio. What is amazing is the price at this top....... $9.47. This price is squaring out with the position of mars. This is just a few cents short of 360 degrees from the $5.90 low. In other words price rallied a complete cycle around the circle and topped in the same place on the circle as the May 11, 2011 low. Only here at the top it was squaring out with mars instead of the earth.
The rally in the summer of 2012 was almost exactly 360 cents. The remarkable order is seen when we understand that it occurred WHEN two different planets took their turn to arrive at the same location on the circle. Our initial examples in this segment showed two different planets (time) arriving at the the same location on the circle in turn. This last example illustrated how price arrived at the same place on the circle WHEN the planets were arriving there. This should put an exclamation on our assertion that time and price are intimately connected.
Once again it is important to note that these turning points are where the market turns for significant moves. They are the extreme reached in price, not a "hidden" turn that is difficult to identify on a chart.
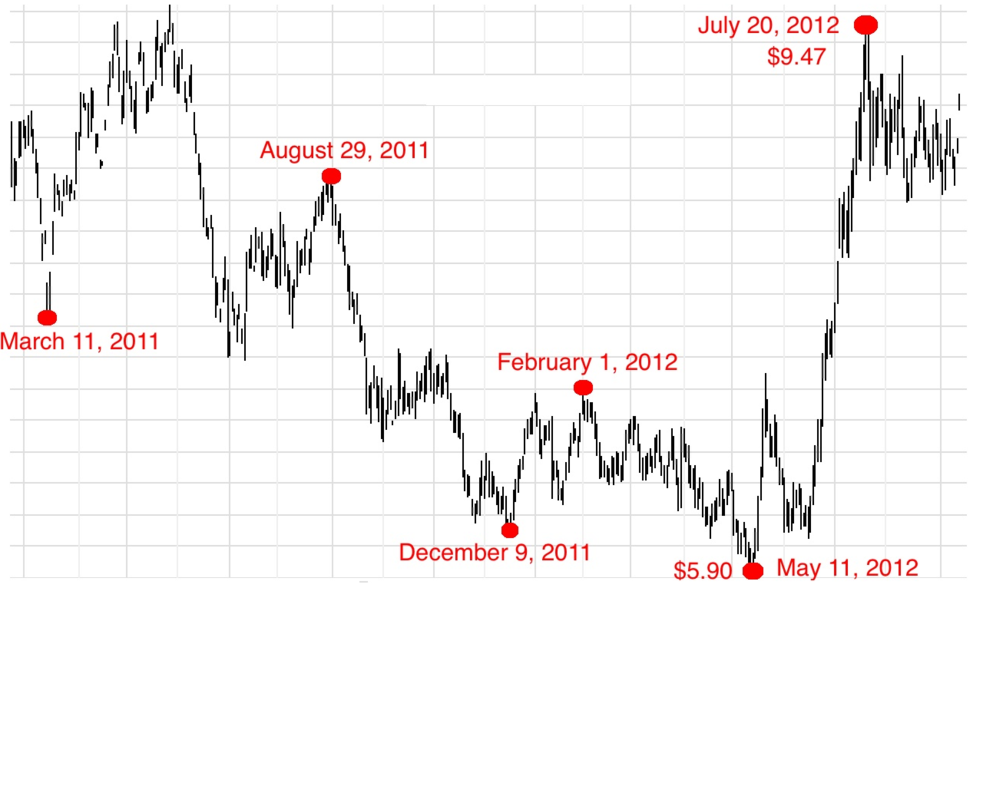
Chicago Wheat (daily)
Return to HOMEpage
Contact us to subscribe to our newsletter.
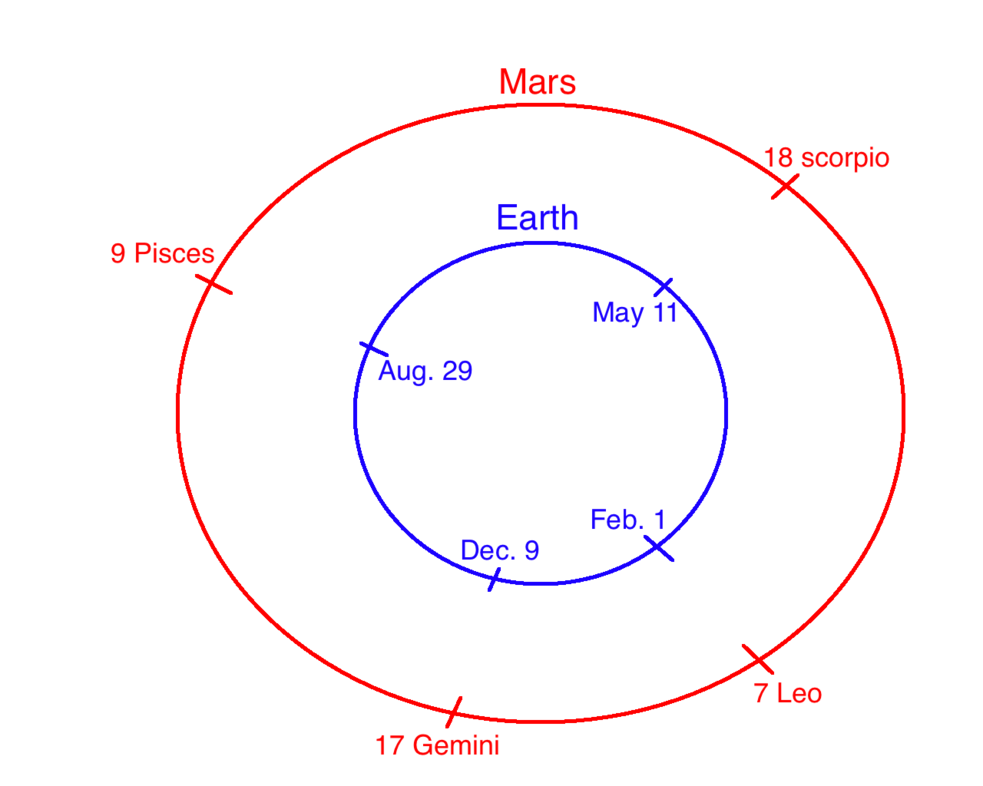
This diagram is an illustration for the explanation below. It shows the heliocentric positions of Earth and Mars at 2011-2012 turning points in Wheat.