
Timing the grain markets through the understanding of cycles.
Identifying the major trends that bring you the most profitable opportunities.
making the complex understandable
Grain Market Timing
EXAMPLES OF PREVIOUS ALERTS
page 2
The following message was posted on the forum at TFC.charts. Please note the date of the message. It was posted November 19, 2009 which is 10 weeks before the predicted turn in the market.
The grains experienced a precipitous drop into this time frame and soybeans made their ultimate low on February 4th, 2010. The projection of that turn was given 10 weeks in advance! To illustrate the value of that knowledge, consider how soybeans reacted from that low. The weekly chart shows that 2-4-10 low to be $9.00. To this day, that price has not been broken on the weekly chart. That's well over a year later and prices haven't broken that level. What's more, soybeans rallied $5.54 from that low. Hopefully, the reader will begin to gain an appreciation for the value of cycles. It allows the analyst to identify points in time and price where the market trends begin and end. In today's explosive environment, the value of understanding these market cycles cannot be overstated.
Below is a message posted shortly after the trend was changing.
cycles nailed it again!Posted By: <jonbrueg@yahoo.com>
Date: Monday, 22 February 2010, at 1:34 p.m.In the middle of November, I posted that the January 25-29 time period would be a major trend change in the grains. That is a prediction made 10 weeks in advance. The low has been February 4th, with some contracts actually making the low ON 1-29-10. Again, what is so valuable about this knowledge is that it identifies places where the market will not break in price which gives places to enter the market with the least amount of risk possible. It also lets one get in on almost the entire move of the trend. These cycles, when accurately understood, are the most profitable trading tool available, period.
.
Illustrating charts coming soon.
We published our first newsletter on April 30th, 2011. It warned readers that "the tops were in". It also stated that the grains were making a secondary top that would send prices lower immediately. As you can see from the chart on the left, the highest that wheat has traded since the major top of February 10, 2011 is the date we went public. So, not only has wheat NOT made new highs, prices halted their advance precisely on the weekend our prediction was published. This is the power of cycle knowledge. Wheat is experiencing an almost complete meltdown, dropping over $3.00. Sign up now and receive information on the next move in the grain markets.
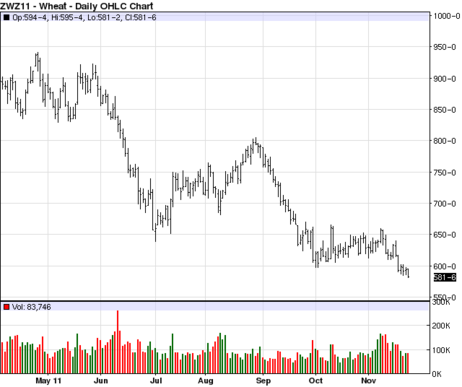
W = April 26th, 2011 the day we began preparing our newsletter warning of a top that would send prices much lower.
W
SOYBEANS: Back in April of 2011 we went on record to say that $14.55 would not be broken on the nearby chart! On August 31 of that year, the top was again $14.56! Beans then dropped $3.60!! Predicting market behavior is a very difficult thing to do. However, knowledge of cycles is a most powerful tool. Subscribe to our service to be kept up to date on the changing trends in the grain markets. Today's volatile moves are much too valuable to be caught unaware. We believe our service is simply the most accurate source for predicting grain market behavior.