
Timing the grain markets through the understanding of cycles.
Identifying the major trends that bring you the most profitable opportunities.
making the complex understandable
Grain Market Timing
As we continue in this analysis, please keep in mind what is taking place. When the market is turning, there is a relationship between time and price. This relationship takes the form of 3 points that form a triangle with 2 sides of 144 degrees. The most remarkable fact is that these are THE biggest trends. The turning points under examination are the extreme. We are not picking a secondary top or bottom that does not stick out on a chart. These points are the absolute highest or lowest in a given move and yet the principle holds to a remarkable degree of accuracy.
There is a significant risk of loss in trading Futures & Options. Past performance is not indicative of future results. Any decision to purchase or sell as a result of the opinions in this report will be the full responsibility of the person authorizing such transaction.
Copyright © 2011 Grain Market Timing, All rights reserved. Contact us at jon@grainmarkettiming.com 402-768-2670
THE SQUARE OF TWELVE (part 2)

Continued examples of 144 in Corn
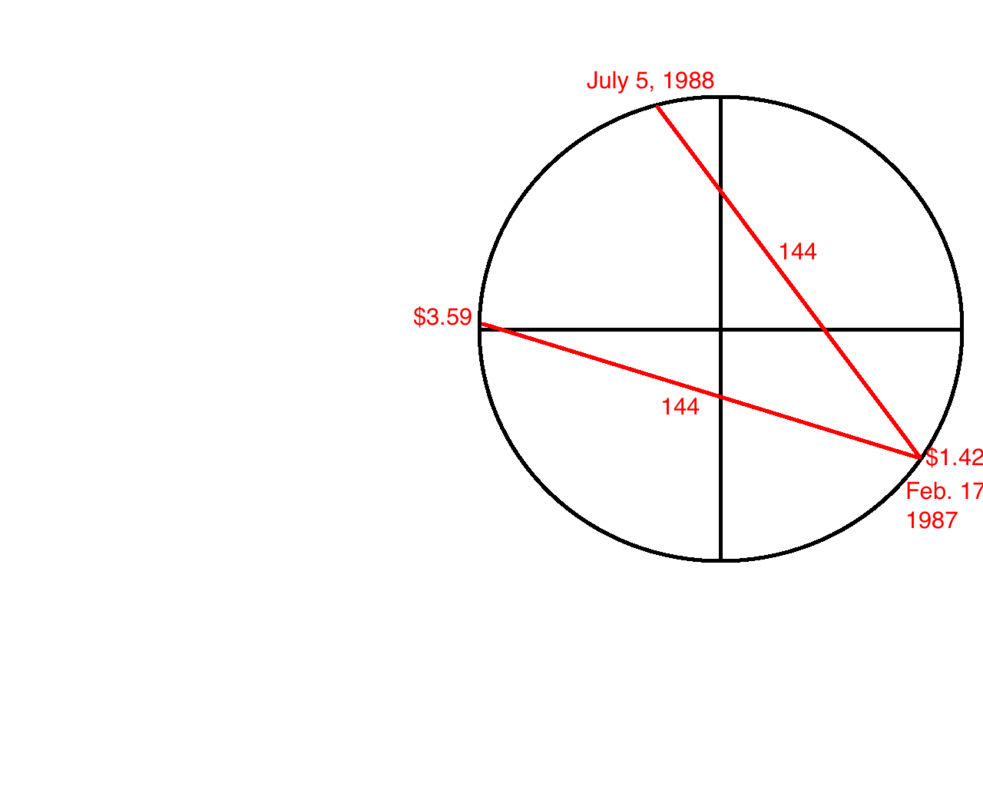
On February 17, 1987 nearby Corn makes a MAJOR low at $1.42. This low comes very close to "squaring out" with the position of the earth. By now, the reader should understand that to mean that the earth's position on the circle is very close 142 degrees past zero. From this low the trend continues up until July 5, 1988 where a MAJOR high is made at the price of $3.59. This entire bull phase is defined by the square of twelve. Firstly, notice the movement of price on the circle. From 142 to 359 is 217 degrees which is 143 degrees from a complete circle. This means that these 2 prices are forming one side of a 144 degree triangle. Secondly, notice where the earth (time) is on July 5, 1988. The earth is at the position of 283. It travelled a complete cycle plus 144 degrees. This means that the 2 prices of $3.59 and $1.42 form a 144 degree triangle with the position of the earth. This is another great example of the intimate link between time and price.
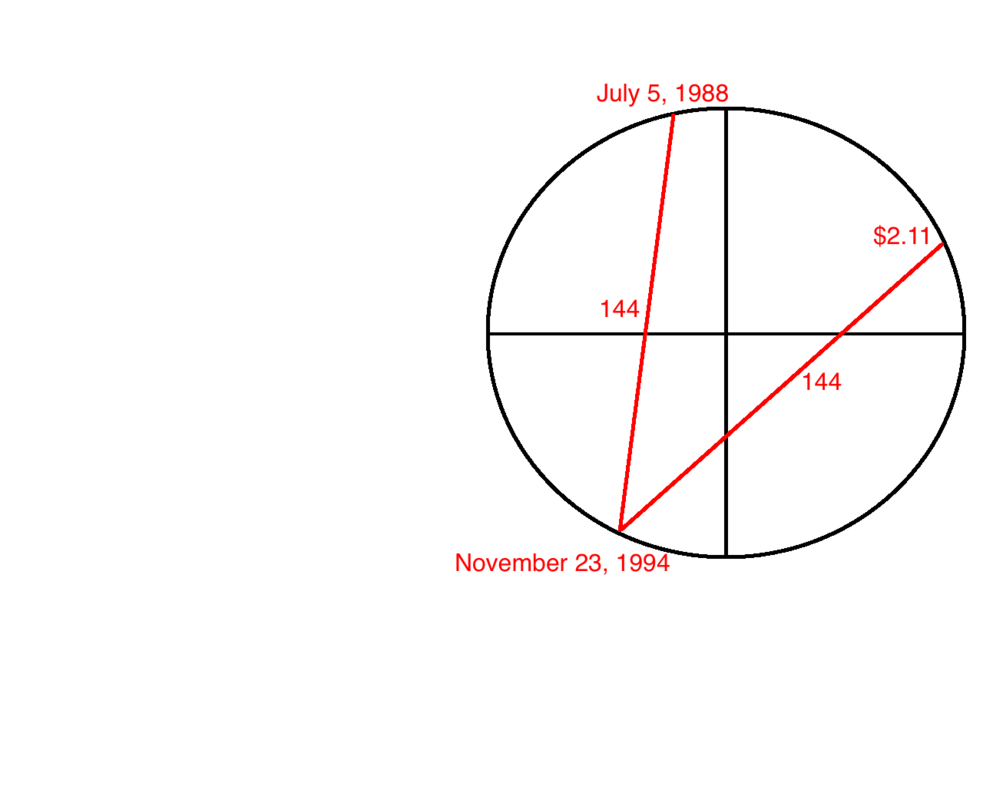
From this 1988 top, Corn drops over the next 6 years to the low of November 23, 1994 at $2.10. It is often viewed as a sideways market, but the 1988 top was the highest and the November 1994 low was the lowest. This downtrend is defined by the square of 12 (144). It ends when the earth reaches the point that is 144 degrees past July 5, namely November 23, 1994. The fact that 6 extra years are included should not cause concern. This is the amount of time it took for a different cycle to complete and align with the earth. For now, it's important to understand that the earth fit perfectly in this timing mechanism even though 6 extra cycles passed, waiting for the other cycle to finish. Now, as we have shown in all previous examples, the price of $2.10 should also form a 144 degree triangle with these 2 dates of July 5 and November 23. And that is exactly what happens as can be seen in the diagram.
Now I would like to illustrate how universal these principles are. They can be found in all the grain markets namely Corn, Wheat and Soybeans.
On August 7, 2013 nearby Soybeans made an important low. From this low the major trend was higher until May 22, 2014 where nearby prices topped out at $15.36. One can quickly calculate this span of time to be 288 days. This is 144 x 2. If we plot the position of the earth from August 7th to May 22 on the circle of 360 degrees we see that the earth travelled from 314 to 600. The fact that the trend was defined by 144 is interesting enough, but of course the markets display an even greater degree of order. A major theme of this tutorial is the assertion that time and price are closely related. When we measure the two positions of time against the position where price finally topped, this remarkable principle is once again discovered. The price of $15.36 is the exact midpoint of the earth's motion during these 288 days. If we subtract several multiples of 360 out of 1536 we see that 1536 is the same location on the circle as 816. This position of 816 (1536) is 144 degrees from both May 22 and August 7!
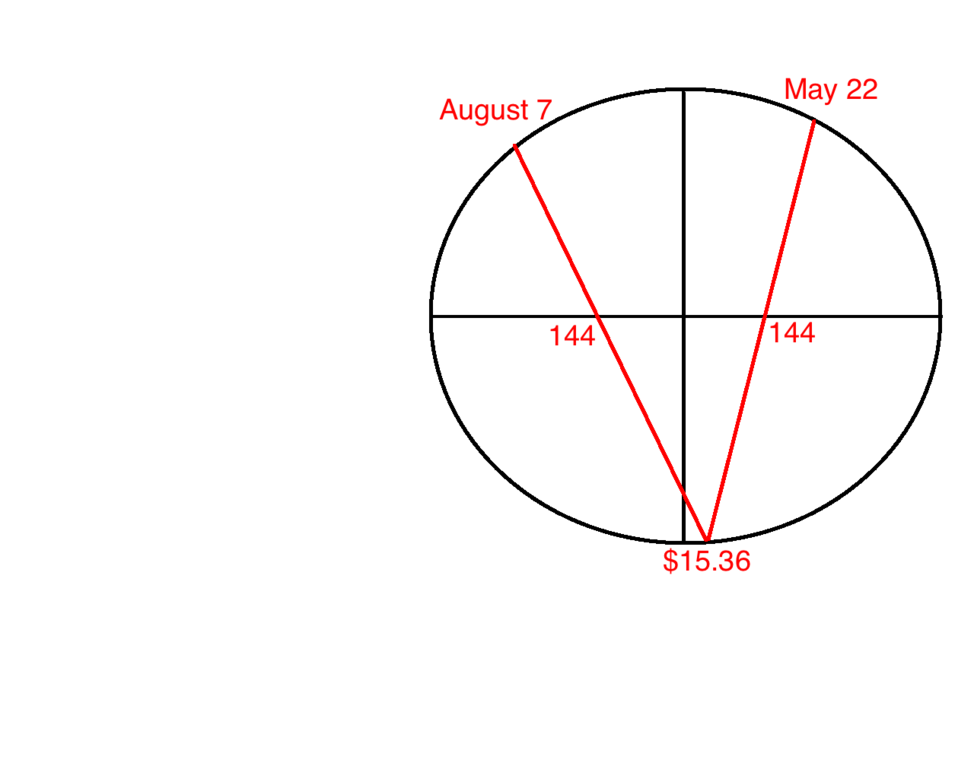
Take a close look at this diagram. This "square of 12" triangle perfectly models the behavior of nearby soybeans. The 288 day bull trend from the low of August 7, 2013 to May 22, 2014 illustrates how the motion of TIME defined exactly how far PRICE would stretch. 288 is the second "square of 12". In other words, 144 x 2 = 288.
SOYBEAN EXAMPLE
Wonderful example of 144 in Soybeans
Nearby Corn 1987 - 1988
Nearby Soybeans 2013 - 2014
Back to HOME page