
Timing the grain markets through the understanding of cycles.
Identifying the major trends that bring you the most profitable opportunities.
making the complex understandable
Grain Market Timing
There is a significant risk of loss in trading Futures & Options. Past performance is not indicative of future results. Any decision to purchase or sell as a result of the opinions in this report will be the full responsibility of the person authorizing such transaction.
Copyright © 2011 Grain Market Timing, All rights reserved.
"The Future is a Repetition of the Past" continued
This page contains more examples of actual market behavior. We simply wish to provide further proof of Gann's assertion that the future does in fact repeat the past. This entire tutorial has relied on the actual market data to illustrate the concepts presented. We know of no other publication or author who uses recorded history to demonstrate these concepts. We are not just presenting the theoretical. Our research has led us to these discoveries, and our research has always been grounded in the nuts and bolts of actual market behavior.

This analysis began at the October 30, 1973 low and has progressed along a continuous time line. However to further illustrate this principle of Time moving thru Price, I would like to skip ahead to the year 1987 which contains a very similar example. After the 1987 example is presented we will return to this September 1977 low to resume the analysis.
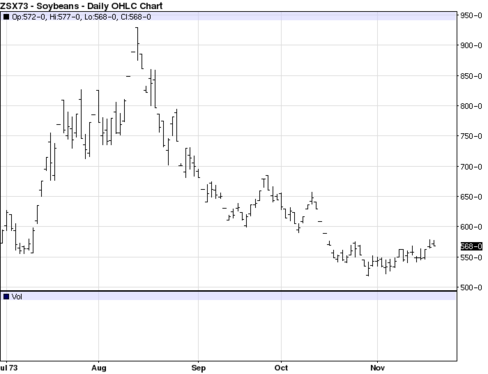
Another example showing the repetitive nature of the markets can be seen when comparing the declines in 1973 to what occured in 2009. Let's look at how closely this move repeated. In 1973 soybeans topped in early June at $12.90 and bottomed in October at $5.18. Now, let's compare that explosion to what took place in 2009. On June 11, 2009 nearby soybeans topped at $12.91 nearly identical to the 1973 time of year AND price! The market then bottomed on October 4, 2009 at $8.78. Compare that bottom to the October 30, 1973 low of $5.18. The two prices are the exact same location on the circle. In other words 878 = 518 + 360. Another way to look at these two declines is to notice that the 772 cent drop in 1973 was repeated in the 412 cent drop in 2009. It's just that in 2009, the market did not drop the extra 360 degrees around the circle. They also both have last gasp highs on August 14th. Study carefully what is represented on this page. It is strong proof that when the markets are studied on the circle of 360 degrees, a wonderful order is revealed.
Please contact us at jon@grainmarkettiming.com 402-768-2670
Back to HOME page
Soybeans 1973 vs 2009
Two identical declines
Two identical declines
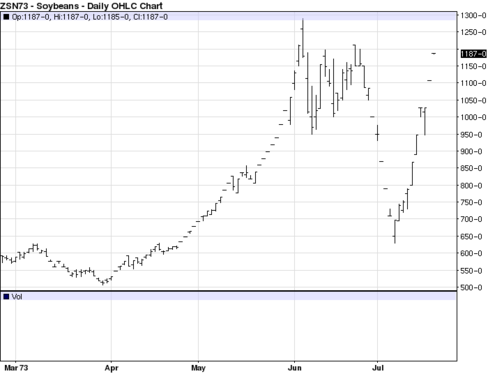
July 1973 beans top at $12.90 --->
on June 5th.
on June 5th.
November 1973 beans bottom at $5.18 ---->
<---- August 14, 1973 $9.29
July 1973 Soybeans Daily
November 1973 Soybeans Daily
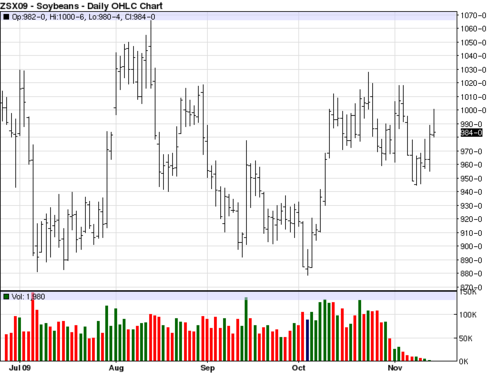
<---- August 14, 2009
<---- $8.78
November 2009 soybeans
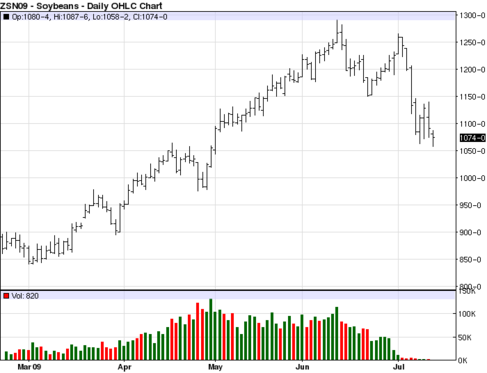
June 11, 2009 $12.91 --->
2009 July soybeans
Next concept: Wheels with wheels